
One of the pillars of a good monitoring strategy is to create the perfect dashboards for the right people. To do this it is always important to follow some best practices:
- Conduct a brainstorming session with the concerned person or team.
This is the first step that you need to take. The goal is to assess the needs and to take into consideration what makes sense for the person, or team, that is going to use the dashboard. You are not only going to get inputs and translate them, you will have an interactive discussion where you can evaluate and adapt the suggestions to the capabilities and constraints of the observability tool.
- Define the required metrics
Now you know more or less what your dashboard needs to display. Most observability tools provide hundreds of metrics out of the box. But in some cases, especially for business metrics, you need to create them. In AppDynamics there are multiple ways to do that via:
- Information points
- Data collectors
- DB custom metrics
- Custom extensions: This when the out of the box solution doesn’t work for you.
- Structure your dashboard
This step is all about designing the dashboard in the most elegant and user friendly way possible.
A. Group metrics by sections.
Dashboards can really get very complex and you need to keep it simple to understand. Grouping the metrics by section will help the users map the dashboard and detect problems very quickly.
B. Structure the most important KPIs to the top of the dashboard.
By placing the most important metrics on the top of the dashboard and displayed in a large font it is another way to help the user focus on what matters the most.
C. Health indicator.
This is a crucial element in all successful dashboards. Add the health of a metrics by adding an indicator that will change color when the metric behaves in an abnormal way. For example, we can put a health indicator for the response time of the checkout transaction of a very busy ecommerce website. This metric is very important because if it goes beyond the baseline it will directly affect the business by having more drop-offs at this critical step in the purchase process. In AppDynamics health indicators are created using health rules. You can of course use the out of the box available health rules but in many cases you will need to configure your own health rules.
When starting a dashboard project you will be required to provide multiple dashboards to different teams with different interests. Here are the most common types of dashboards that you need to keep in mind.
1 – The Application Dashboard
This dashboard will focus on a specific application. It’s usually designed for operations and application owners, the development team can also use it to have a better understanding of their application in the production environment.
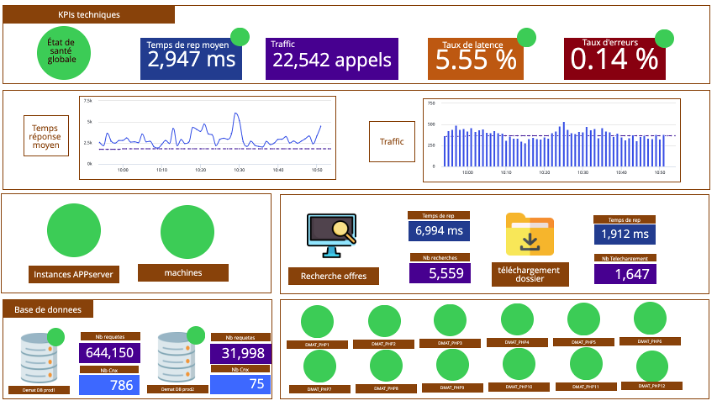
We can notice that in this application dashboard we respected the good practices by dividing metrics into sections and putting the KPIs on the top. The health indicators are also present giving us an overview of the health of the different components of the application.
What type of metrics should be displayed in the application dashboard?
- KPIs:
- Average response time
- The load number of request processed by your application
- The rate of slow requests
- The rate of errors and exceptions
- Hardware metrics: CPU, memory ,.. If you have multiple servers you should group all the server heath in one single health indicator to provide a quick overview of how the hardware is functioning.
- JVM and CLR health
- DB response time, load and health
- Most important transaction response time for example: Login. Depending on the application a list of the most important transactions should be defined during the brainstorming session.
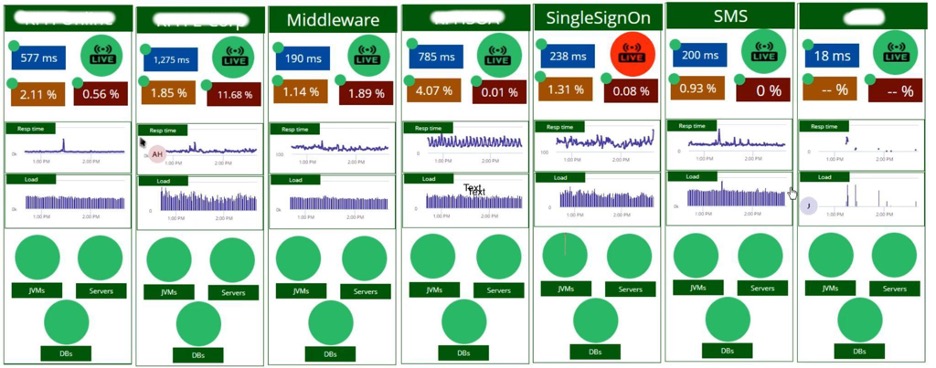
2 – The Overall Dashboard
This dashboard is designed for the operations and management. It should allow them to see ‘The big picture’. It will include all monitored applications with their KPIs
3 – The Business Dashboard
A business dashboard is important for the business team and senior management, it will allow them to quickly and easily access metrics from the production applications. This type of dashboard usually requires additional effort to collect the metrics. My advice: try to make use of available metrics as much as you can. Involve developers to help you find where to collect the requested data.
The best way to display the dashboards.
In Perform IT, we always advise our customers to display the dashboard on big LED screens. With the auto-refresh option you keep the dashboard visible to the team. We also make sure that email alerting and scheduled reports are on. When everything is set you will rarely miss a problem or an alert.

Here is a nice example with our amazing customer, Banque Misr in Egypt, where they displayed the overall dashboard inside the monitoring team office.
For more details please don’t hesitate to contact us. We can arrange a session with our consultant to help you on your observability journey.